Confidential Broker Opinion of Value
413 E Elk
Glendale, CA 91205
15Units
10,013Square Feet
1985Year Built
11,496SF Lot
Luka Leader
Luka Leader
Associate Investments
Glen Scher
Glen Scher
Senior Managing Director Investments
Filip Niculete
Filip Niculete
Senior Managing Director Investments

Prepared Exclusively for Ownership of 413 E Elk Avenue

September 2026

Team Track Record
Current Results, Local Market Experience, and Senior-Level Execution
LAAA Team | Marcus & MillichapLocal market knowledge. National reach. Senior-level execution.
494Closed Transactions
342Apartment Sales
20Within 5 miles
$1.56BTotal Sales Volume

LAAA Activity in This Market

AddressUnitsPrice$/UnitStatus
4603 La Mirada Avenue & 1255 Lyman Place3.93 mi9$4,450,000$494,444Listed
1807 Montana Street4.35 mi4$2,395,000$598,750Listed
1303-1305 Laveta Terrace4.47 mi10$2,590,000$259,000Listed
3361 Hamilton Way3.95 mi4$2,800,000$700,000In Escrow
1027 Grover Ave2.64 mi8$3,065,000$383,125Sold 2023
328 E Providencia Ave3.88 mi11$5,175,000$470,455Sold 2023
1443 E Maple St1.06 mi6$1,575,000$262,500Sold 2019

Listed and in-escrow rows are current LAAA Team assignments within 5 miles, shown at asking price as published at laaa.com/listings, as of September 14, 2026. Sold rows show the closed sale price.

96.7%Apartment Pricing Accuracy
34Median Days on Market, Apartments

Published team performance, laaa.com/track-record, as of September 14, 2026.

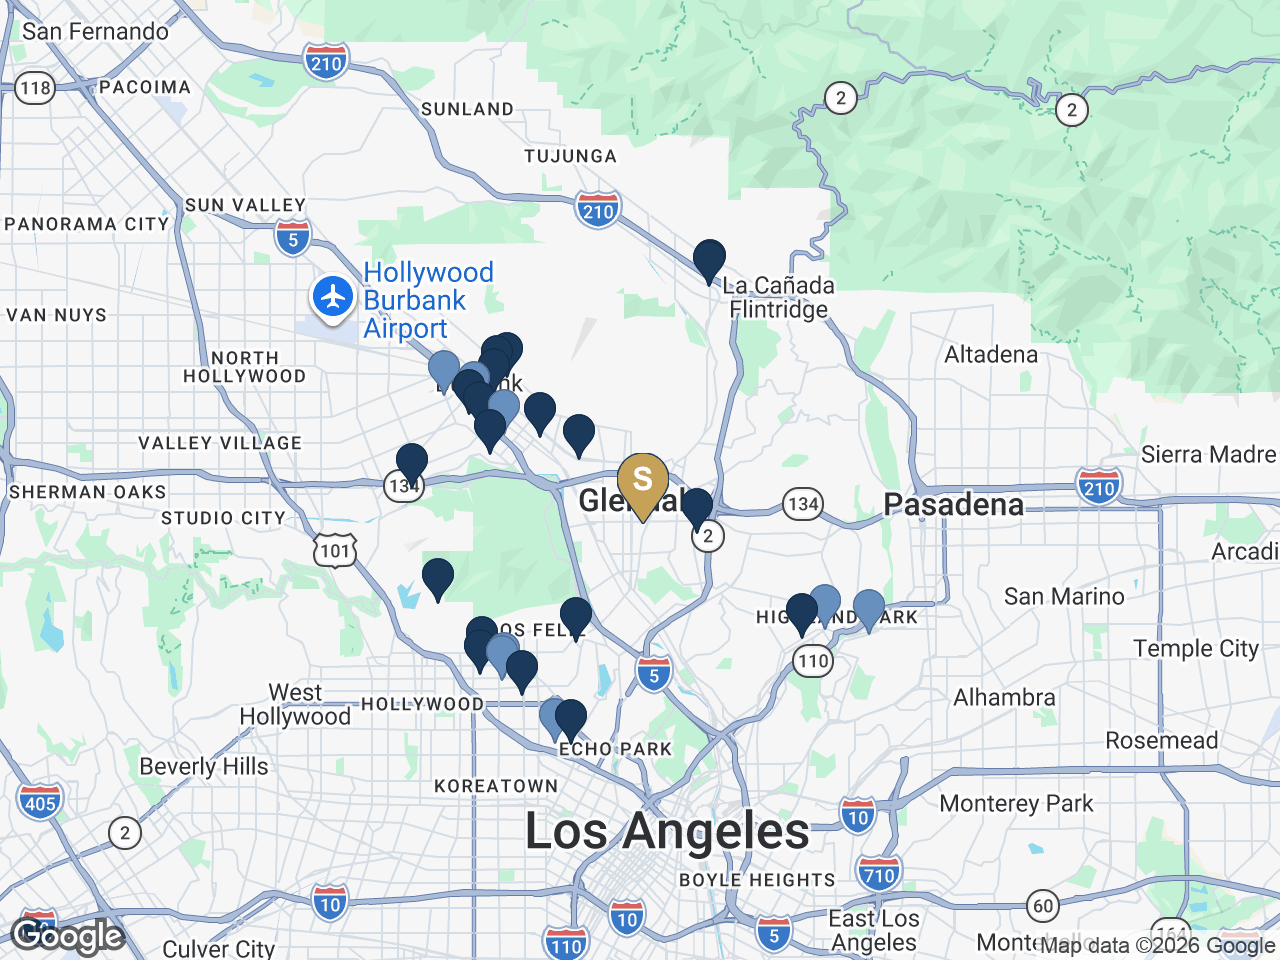
LAAA closings near 413 E Elk

413 E Elk is the gold marker. Navy markers are the 20 apartment buildings the LAAA Team has closed within 5 miles; lighter markers are 8 other LAAA closings in the same area. Repeat sales at one building share a marker. Source: laaa.com/track-record, as of September 14, 2026.

A Track Record Built One Assignment at a Time

Of those closings, 342 are apartment sales covering 4,703 units. CoStar ranked LAAA the most active multifamily team in Los Angeles County from 2019 through 2021, and the team has not finished a quarter without a closed sale since it was founded.

Volume matters here for one reason: it is where the buyer list comes from. The buyer for a fifteen-unit Glendale building with a Section 8 rent roll is far more likely to be an owner this team has already closed with, or an owner this team has already called, than someone who finds it on a portal.

The Team Behind the Assignment
Luka Leader
Luka Leader
Associate Investments
Luka Leader is an Associate with the LAAA Team at Marcus & Millichap, focused on multifamily investment sales across Los Angeles County. A University of Southern California business graduate with a concentration in accounting, he underwrites every listing before it goes to market and stays on the deal from pricing through closing.
Glen Scher
Principal
Glen Scher
Senior Managing Director Investments
Glen Scher co-founded the LAAA Team and specializes in multifamily investment sales across Los Angeles County. He advises private owners and family partnerships on valuation, disposition, and exchange strategy.
Filip Niculete
Principal
Filip Niculete
Senior Managing Director Investments
Filip Niculete co-founded the LAAA Team and focuses on multifamily investment sales throughout Los Angeles County, advising private capital and institutional owners on pricing, positioning, and execution.
Key Achievements

Chairman's Club, Marcus & Millichap's top-tier annual honor
National Achievement Award, multiple years, both partners
#1 Most Active Multifamily Team in LA County, CoStar 2019-2021
Sales Recognition Award, every year since 2016
494 closed transactions, $1.56B in sales volume

As Featured In
How We Market Your Property
Position the Story, Reach the Market, and Work the Buyer List
23,500+Active Email Subscribers
36,000+Owner & Investor Contacts
60,000+Buildings Tracked
100+Targeted Buyer Calls

Our public, continuously maintained reach combines active email subscribers, owner and investor contacts, a building-owner database, and targeted direct buyer calls for each listing.

We are proactive marketers, not reactive.

The Campaign Plan

01

Named Calls Into the Glendale, Burbank and Northeast LA Owner Pool

We build the call list from the county assessment record for every apartment building of five to thirty units in Glendale, Burbank and the northeast Los Angeles neighborhoods that border them: who owns it, where their mail goes, what they paid, when they bought, and how many other buildings they hold. Owners who already operate Section 8 tenancies in this size class are the shortest path to a buyer for this building, and the assessment record tells us who they are.

02

The Buyers Who Just Closed on Glendale Apartments

Three Glendale apartment buildings of sixteen to twenty units closed between March and June 2026, and 333 N Jackson Street drew a buyer who paid 106.8% of its list price in sixteen days. Every one of those buyers, and every underbidder we can identify, is an active, proven pool of capital that has already written a check for this product in this city. They get called by name.

03

Platform Distribution and a Dedicated Offering Site

National listing distribution, the Marcus & Millichap investor database, a property-specific offering site, and targeted email to the private investors and exchange buyers who trade five to thirty unit buildings in the San Fernando Valley, Glendale and Pasadena.

Direct owner and buyer outreach

Named calls into the Glendale and Burbank apartment owner pool, the operators who already hold Section 8 tenancies in five to thirty unit buildings, and the 1031 exchange buyers who trade in this size class.

Marcus & Millichap platform

National listing distribution, the firm's investor database, and coordination with MMCC on agency and bank debt so a buyer arrives pre-qualified rather than exploring.

Dedicated digital presentation

A property-specific offering site, targeted email, and syndication to the investor platforms buyers in this market actually search.

Most brokers are reactive. They post the listing, run an email blast, and wait for the phone to ring. We do all of that, and we do it well. Then we do the part almost nobody does. We pick up the phone.

Before your building goes to market, our system builds a probable buyer list for it specifically. It pulls the county assessment record for every property in the surrounding area: who owns it, where their mail goes, what they paid, when they bought, who financed it, and how many other buildings they hold. Out of that come the three groups most likely to buy your building: owners of comparable product nearby, buyers who have closed on buildings like yours recently, and exchange buyers with money that has to be placed on a deadline.

That list runs well over 100 names, and we call every one of them.

Buyer Profile & Transaction Strategy
Who Is Most Likely to Buy, and How We Create Competition

Market Context

Glendale apartment buildings are trading. Three buildings of sixteen to twenty units closed between March and June 2026: 453 Ivy Street, seventeen 1984 two-bedroom units with an elevator, at $7,250,000; 333 N Jackson Street, twenty 1963 units, at $4,806,000; and 332 Riverdale Drive, sixteen 1963 units, at $3,135,000. Per unit that is $426,471, $240,300 and $195,938.

That demand is disciplined, and it rewards income. Jackson Street, with one-bedrooms leased at $1,623 and select units renovated, was listed at $4,500,000 and sold for $4,806,000 in sixteen days. Riverdale Drive, with one-bedrooms leased at $1,522 and no renovation story, was listed at $4,300,000, cut twice, and closed at $3,135,000 after 214 days. Buyers in this market pay for rent that is already in place, and they wait out a number the rent roll does not support.

Positioning Thesis

A fifteen-unit building with rents at market, a renovation behind it, no resident manager requirement and thirteen rents paid in large part by direct deposit is the product a private income buyer pays the most for. It carries none of the lease-up work Riverdale Drive needed and more rent per square foot than Jackson Street. Positioning 413 E Elk to that buyer, at a number the Jackson Street sale supports, is the core of the recommendation.

Likely Buyer Profiles

Likely Buyer 01

The Section 8 Operator Adding a Fifteenth Door

A private owner who already holds Housing Assistance Payments tenancies and knows what a rent roll paid by direct deposit is worth. This buyer prices the inspection history, the fifteen-unit manager exemption and the January 2027 increase schedule, and does not discount the building for its tenant base.

Likely Buyer 02

The Glendale and Burbank Private Investor

A private owner who already holds five to thirty unit product in Glendale, Burbank or northeast Los Angeles and wants a fully occupied, renovated building with separately metered utilities, subterranean parking and no deferred capital work, in a submarket where a comparable one-bedroom asks $2,195.

Likely Buyer 03

The 1031 Exchange Buyer Placing Under $5M

Exchange money with a deadline and a need to place under $5M in one asset. A stabilized fifteen-unit building with agency-financeable income solves an identification problem that a value-add building does not, and it closes on a lender's timing.

Transaction Strategy

01

Sell the Income: Renovated, Fully Occupied, and Paid by Direct Deposit

The rents at 413 E Elk are already at market for a 649 square foot one-bedroom, thirteen of the fifteen are paid in large part by the housing authority, and the building has a new roof, new plumbing and electrical, new windows and renovated units. This is not a value-add story and should not be priced like one. It is a clean, fully occupied fifteen-unit building, one unit under the sixteen-unit line where California requires a resident manager, in a city where three comparable buildings traded between $3,135,000 and $7,250,000 this year. The campaign leads with the income, the renovation and the parking, and prices at a number the three closings support.

Investment Overview
413 E Elk Ave, Glendale, CA 91205
15Units
10,013Building SF
1985Year Built
11,496Lot SF

The LAAA Team of Marcus & Millichap is pleased to present 413 E Elk Avenue, a fifteen-unit apartment building in the Mariposa neighborhood of Glendale, built in 1985 on an 11,496 square foot lot and containing 10,013 gross square feet per the Los Angeles County Assessor. The building is two stories over a subterranean garage with 23 parking spaces, on a wood-frame structure zoned GLR4.

The unit mix is fourteen one-bedroom, one-bath units of about 649 square feet and one two-bedroom, two-bath unit of about 927 square feet. The ownership rent roll dated August 8, 2026 shows every unit occupied at $30,700 per month, $368,400 per year, plus $150 per month of laundry income from two laundry rooms with owned equipment. Thirteen units are leased under Section 8 Housing Assistance Payments contracts at $1,950 to $2,190 per month; the two remaining units, the two-bedroom at $2,500 and a one-bedroom at $1,900, are market tenancies. Gas and electric are separately metered and tenant paid; the ownership pays water, power for the common areas, and trash.

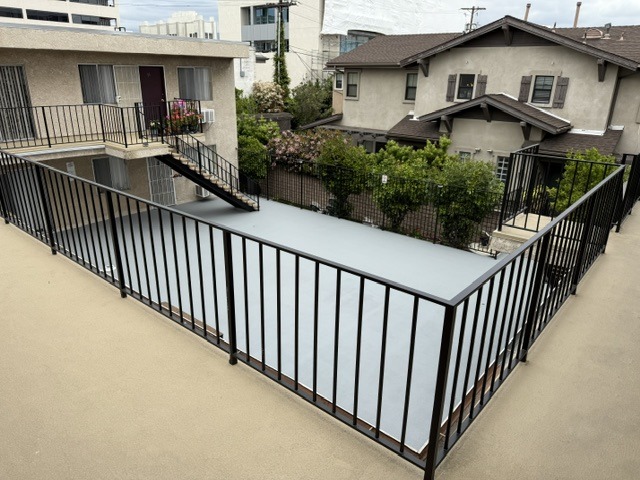
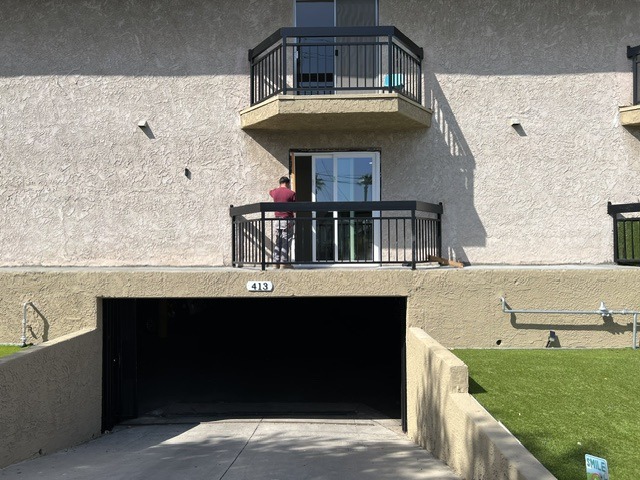
The ownership reports a renovation that reaches every major system: every unit updated, new sliding glass doors and windows throughout, new flooring, a new roof, new plumbing and electrical, balconies repaired and fitted with new guardrails, and a new turf front yard. The building passes its annual housing authority inspections. Twenty-three subterranean spaces are provided to tenants at no charge today.

The rents are at market for the unit size. One-bedroom asking rents within a mile run $1,995 to $2,225, and the subject's one-bedrooms average $2,047 with the most recent leases at $2,185 to $2,190. The pro forma in this analysis brings each one-bedroom to $2,195 and the two-bedroom to $2,795, inside those asking rents, and the recommendation does not depend on it. The ownership reports Section 8 contract rent increases scheduled to take effect January 1, 2027; those increases require housing authority approval and are presented as upside, not capitalized.

Value is carried by price per unit, price per square foot, capitalization rate and gross rent multiplier against the three Glendale apartment buildings of sixteen to twenty units that closed between March and June 2026, each rebuilt on the same expense basis as the subject. Fifteen units is a structural advantage in that comparison: every one of the three comparables must carry a resident manager, and this building does not.

413 E Elk

Investment Highlights

  • Fifteen units on an 11,496 square foot lot a block west of Glendale Avenue, built in 1985, 10,013 square feet per the Los Angeles County Assessor.
  • Fully occupied at $30,700 per month in scheduled rent: fourteen one-bedroom, one-bath units at $1,900 to $2,190 and one two-bedroom, two-bath unit at $2,500, plus laundry income.
  • Thirteen of the fifteen units are leased under Section 8 Housing Assistance Payments contracts. Per the ownership, the housing authority pays the larger share of each rent by direct deposit eight days before it is due, and the building passes its annual inspections.
  • Renovated throughout per the ownership: every unit updated, new sliding glass doors and windows, new flooring, a new roof, new plumbing and electrical, and balconies repaired with new guardrails.
  • Twenty-three subterranean parking spaces, provided to tenants at no charge today, and two laundry rooms with owned Speed Queen washers and dryers under no lease.
  • Fifteen units sits one below the sixteen-unit threshold at which California requires an on-site resident manager; the three comparable sales in this analysis all carry that cost.
  • No local rent cap in Glendale; AB 1482 allows increases of 5% plus CPI, 8.7% for the year beginning August 1, 2026.
  • The one-bedrooms average $2,047 against a $2,195 median asking rent for comparable units within a mile; the two-bedroom at $2,500 sits below the $2,650 to $2,850 asked for smaller two-bedroom, two-bath units nearby.
Location Overview
A Block Off Glendale Avenue, Walkable to Downtown Glendale and the Galleria

The property sits on East Elk Avenue one block west of South Glendale Avenue in the Mariposa neighborhood, zip code 91205, south of downtown Glendale. Maple Plaza at 620 S Glendale Avenue is 0.05 miles away, five shopping centers sit within 0.3 miles, the Glendale Galleria is 0.6 miles north, and Glendale Memorial Hospital is under a mile south. Walk Score rates the address 80, Very Walkable, with a transit score of 70.

The Glendale Transportation Center, with Metrolink service on the Antelope Valley and Ventura County lines, is 1.25 miles away. Horace Mann Elementary and Theodore Roosevelt Middle School are each half a mile, and Glendale High School is 1.1 miles.

This is the part of Glendale where a renovated 650 square foot one-bedroom asks $2,195 and where sixteen to twenty unit buildings trade to private investors: 333 N Jackson Street, a half mile north, sold in April 2026 at 106.8% of its list price in sixteen days. Every one of the three comparable sales and all six of the relied-on rental comparables sit within 1.1 miles of the subject.

Property & Location Details
Address413 E Elk Ave, Glendale, CA 91205
CityGlendale, CA 91205
APN5641-004-022
Year Built1985
Building SF10,013
Lot Size11,496 SF (0.2639 ac)
Units15
Parking23 subterranean parking spaces
Location Map
Property Details
413 E Elk
Property Overview
Units15
Year Built1985
Building SF10,013
Lot SF11,496
APN5641-004-022
Unit Mix
14x 1 Bed / 1 Bath649 (est.) SF
1x 2 Bed / 2 Bath927 (est.) SF

Fifteen units, 10,013 gross square feet, on an 11,496 square foot lot, Lot 49 of Grider and Hamilton's Lomita Park Tract. The Los Angeles County Assessor records the property under APN 5641-004-022 as an apartment building of five or more units built in 1985 of wood-frame construction with sixteen bedrooms and fifteen baths, and the unit count, year built, building area and lot size in this analysis all tie to that record.

The improvements are two residential stories over a subterranean garage of 23 spaces, with fourteen one-bedroom, one-bath units and one two-bedroom, two-bath unit, unit balconies, two laundry rooms with owned Speed Queen equipment, and a turf front yard. Gas and electric are separately metered to the units. The rental portals list the building at two stories with covered parking.

Unit square footage is stated by the ownership as approximate: the one-bedrooms are carried at an estimated 649 square feet and the two-bedroom at an estimated 927, which together equal the assessor's 10,013 square foot building area.

The parcel is zoned GLR4, Glendale's high density residential district. Glendale has no local rent cap; the building is covered by AB 1482, which caps annual increases at 5% plus CPI (8.7% from August 1, 2026) with just cause eviction, and by Glendale's Rental Rights Program, which adds a right to a one-year lease and relocation assistance for a tenant who elects to move after an increase above 7%.

Property Photos
413 E Elk
1 / 10 413 E Elk photo
Exterior

Click any image to enlarge. Images depict the property and representative interiors. Source: listing media and site photography.

Rent Comparables
Achieved and Asking Rents in the Immediate Submarket
Rent Comps Map

One Bedroom Comparables

AddressUnit TypeSFAsking RentDistance
11123 E Elk Ave Apt 31 Bed / 1 Bath700 (est.)$2,1950.58 mi
2331 W Windsor Rd Apt 61 Bed / 1 Bath550 (est.)$2,1950.60 mi
31377 E Windsor Rd Unit 1111 Bed / 1 Bath750 (est.)$2,2250.97 mi
4323 E Chestnut St Apt 71 Bed / 1 Bath690 (est.)$1,9950.13 mi
Average (4 comps)672 (incl. est.)$2,1520.57 mi

Two Bedroom Comparables

AddressUnit TypeSFAsking RentDistance
5914 E Elk Ave Apt 32 Bed / 2 Bath750 (est.)$2,8500.43 mi
61010 E Maple St Apt 62 Bed / 2 Bath900 (est.)$2,6500.51 mi
7703 E Chestnut St Unit 182 Bed / 2 Bath1,300 (est.)$2,7000.27 mi
Average (3 comps)983 (incl. est.)$2,7330.40 mi

Four current one-bedroom asking rents within a mile run $1,995 to $2,225 per month, a median of $2,195, and three of the four are in remodeled buildings. They are shown as a market sensitivity for the subject's one-bedrooms and are not represented as achieved subject rents.

Two-bedroom, two-bath asking rents run $2,650 for a 900 square foot unit at 1010 E Maple Street to $2,850 for a remodeled 750 square foot unit at 914 E Elk Avenue; a 1,300 square foot condominium unit at 703 E Chestnut Street asks $2,700 and is shown for range only.

The subject's own rents are the best evidence: the one-bedrooms are leased at $1,900 to $2,190 with the four most recent leases at $2,185 to $2,190, and the two-bedroom at $2,500.

Sale Comparables
3 Closed Sales in the Submarket
Sale Comps Map
AddressYrUnitsBldg SFSale Price$/Unit$/SFGRMCapDate
1333 N Jackson St19632013,540$4,806,000$240,300$35511.704.74%2026-04-21
2453 Ivy St19841720,733$7,250,000$426,471$35014.623.61%2026-03-17
3332 Riverdale Dr19631610,916$3,135,000$195,938$28710.735.02%2026-06-16
Median (3 comps)19631713,540$4,806,000$240,300$35011.704.74%-

Glendale apartment buildings are trading. Three buildings of sixteen to twenty units closed between March and June 2026: 453 Ivy Street, seventeen 1984 two-bedroom units with an elevator, at $7,250,000; 333 N Jackson Street, twenty 1963 units, at $4,806,000; and 332 Riverdale Drive, sixteen 1963 units, at $3,135,000. Per unit that is $426,471, $240,300 and $195,938.

That demand is disciplined, and it rewards income. Jackson Street, with one-bedrooms leased at $1,623 and select units renovated, was listed at $4,500,000 and sold for $4,806,000 in sixteen days. Riverdale Drive, with one-bedrooms leased at $1,522 and no renovation story, was listed at $4,300,000, cut twice, and closed at $3,135,000 after 214 days. Buyers in this market pay for rent that is already in place, and they wait out a number the rent roll does not support.

1. 333 N Jackson St - Closest match on unit size, distance and market timing; the most competitive sale in the set. Twenty units, 1963, three stories, pool and courtyard; 13,540 SF, average unit 677 SF against the subject's 668; Unit mix: sixteen 1+1, three 2+1.5, one 2+2; select units renovated; central water heaters; Three two-car garages, seven carports and eight driveway spaces against the subject's 23 subterranean spaces One-bedrooms average $1,623 against the subject's $2,047; scheduled rent $30.33 per square foot against the subject's $36.79; Sold at 106.8% of its $4,500,000 list after 16 days on market; $10,800 of garage rent and $3,600 of laundry; Twenty units require an on-site manager under California law; the subject at fifteen does not

2. 453 Ivy St - Same vintage and the ceiling on price per unit; large units and an elevator make it the superior building. Seventeen 2+2 units of about 1,148 SF plus one non-conforming unit, excluded from the metrics; 20,733 SF, 1984, three stories, elevator, central air, in-unit laundry, subterranean parking with storage; Average unit 72% larger than the subject's; a different product at the same vintage Actual rents on the seventeen conforming units average $2,431, $495,900 per year, with the listing projecting $3,250; the non-conforming unit's $39,000 is excluded; Listed June 2025 at $7,500,000, pending January 2026, closed at 96.7% of list; $4,600,000 PCB Bank loan; Seventeen units require an on-site manager; elevator and interior corridors carry service contracts the subject does not

3. 332 Riverdale Dr - Sets the floor: same unit size and distance, but suppressed rents and a long, twice-reduced marketing history. Sixteen units, 1963, two stories, 10,916 SF, average unit 682 SF; fourteen 1+1 and two 2+1.5; Seventeen carports; no pool per the listing (the assessor pool flag disagrees) One-bedrooms average $1,522, 26% below the subject's; deeply suppressed rents, a value-add sale; Listed October 2025 at $4,300,000, reduced twice to $3,850,000, closed at 72.9% of the original list after 214 days; listing agent on both sides; Sixteen units require an on-site manager

Opinion of Value
Suggested List Price and Expected Sale Range
BasisPrice$/Unit$/SFGRM CurrentGRM Pro FormaCap CurrentCap Pro Forma
Suggested list price$4,095,000$273,000$408.9711.1210.186.24%7.01%
Midpoint$4,047,500$269,833$404.2210.9910.066.33%7.11%
Range bottom$4,000,000$266,667$399.4810.869.946.41%7.20%

Property taxes reassess at the sale price, so the net operating income and therefore the capitalization rate are recalculated at every rung above.

Financial Analysis
413 E Elk

Unit Mix & Scheduled Rent

UnitTypeApprox SFStatusCurrent RentMarket Rent
11 Bed / 1 Bath649 (est.)Occupied$1,950$2,195
21 Bed / 1 Bath649 (est.)Occupied$2,185$2,195
31 Bed / 1 Bath649 (est.)Occupied$1,950$2,195
41 Bed / 1 Bath649 (est.)Occupied$2,190$2,195
51 Bed / 1 Bath649 (est.)Occupied$1,950$2,195
61 Bed / 1 Bath649 (est.)Occupied$1,950$2,195
71 Bed / 1 Bath649 (est.)Occupied$1,950$2,195
81 Bed / 1 Bath649 (est.)Occupied$1,950$2,195
91 Bed / 1 Bath649 (est.)Occupied$2,190$2,195
101 Bed / 1 Bath649 (est.)Occupied$1,950$2,195
111 Bed / 1 Bath649 (est.)Occupied$1,950$2,195
122 Bed / 2 Bath927 (est.)Occupied$2,500$2,795
131 Bed / 1 Bath649 (est.)Occupied$1,900$2,195
141 Bed / 1 Bath649 (est.)Occupied$2,185$2,195
151 Bed / 1 Bath649 (est.)Occupied$1,950$2,195
Total Scheduled Rent$30,700$33,525
Additional Income[1]$150$150
Monthly Scheduled Gross Income$30,850$33,675

Annualized Operating Data

 CurrentMarket
Scheduled Gross Income[2]$370,200$404,100
Vacancy Reserve at 3.0%[3]($11,052)($12,069)
Gross Operating Income$359,148$392,031
Operating Expenses($103,644)($104,959)
Net Operating Income$255,504$287,072
Loan Payments (Illustrative)($191,502)($191,502)
Pre-Tax Cash Flow (Illustrative)$64,002$95,569
Principal Reduction (Illustrative)$32,687$34,703
Total Return Before Taxes$96,688$130,272

Annualized Expenses

 CurrentPro Forma
Contract Services[4]$3,000$3,000
General Administrative[5]$2,250$2,250
Insurance[6]$12,000$12,000
Manager[7]$14,366$14,366
Repairs Maintenance[8]$9,000$9,000
Reserves[9]$3,000$3,000
Taxes[10]$45,628$45,628
Trash[11]$3,900$3,900
Utilities[12]$10,500$10,500
Underwriting Expense Adjustment[13]$0$1,315
Total Operating Expenses$103,644$104,959
Expense Ratio28.9%26.8%
Per Unit$6,910$6,997
Per Square Foot$10.35$10.48

Notes to the Operating Statement

[1] Additional Income: Laundry income of $150 per month as shown on the ownership rent roll; two laundry rooms with owned equipment. No parking income is charged today.

[2] Scheduled Gross Income: Current rents per the ownership rent roll dated August 8, 2026: fourteen one-bedroom units at $1,900 to $2,190 and the two-bedroom at $2,500, $30,700 per month, every unit occupied. Thirteen units are leased under Section 8 Housing Assistance Payments contracts. Pro forma carries the one-bedrooms at $2,195 and the two-bedroom at $2,795, inside the current asking rents for comparable units.

[3] Vacancy Reserve: 3% of scheduled rent, the underwriting floor for a fully occupied building.

[4] Contract Services: Landscaping and pest control underwritten at $250 per month for a turf front yard and small common areas.

[5] General Administrative: Underwritten at $150 per unit per year.

[6] Insurance: The owner's current Mercury policy at $12,000 per year, which the owner reports doubled at the last renewal with no claims.

[7] Manager: 4% of effective gross income. The ownership self-manages today.

[8] Repairs Maintenance: Underwritten at $600 per unit per year, the bottom of the band, for a building with a new roof, new plumbing and electrical, new windows and sliding doors and renovated units.

[9] Reserves: Underwritten at $200 per unit per year, the floor for a building whose roof, plumbing and electrical are new.

[10] Taxes: Reassessed at the recommended price: $44,447 of ad valorem at 1.0854%, the Los Angeles County rate for tax rate area 04045 (the 1% general levy plus voted indebtedness per the 2025-26 Auditor-Controller rate table), plus $1,181 of direct assessments, which are flat charges that do not move with the sale price.

[11] Trash: The owner's reported NASA Services contract at $3,900 per year.

[12] Utilities: The owner's reported Glendale Water and Power at $7,500 and gas at $3,000 per year. Units are separately metered for gas and electric.

[13] Underwriting Expense Adjustment: Aggregate difference between classified T12 expense lines and the modeled current and pro forma operating expense totals.

Owner-reported figures are unaudited. A buyer should verify all income and expenses in due diligence.

Summary
Operating Data
Price$4,095,000
Number of Units15
Price per Unit$273,000
Price per SF$408.97
Current GRM11.12
Market GRM10.18
Current Cap Rate (LAAA calculation: current NOI / recommended value)6.24%
Market Cap Rate (LAAA calculation: market NOI / recommended value)7.01%
Proposed Financing (Illustrative)
Loan Amount$2,661,750
Down Payment$1,433,250
Interest Rate6.00%
Amortization30 years
DCR1.33

Illustrative financing assumption. Not a quoted or committed loan. A buyer should obtain its own terms.

The recommendation is a list price of $4,095,000 with an expected sale between $4,000,000 and $4,095,000. At list that is $273,000 per unit, $409 per square foot, and 11.12 times the $368,400 of scheduled rent. On the model's current income of $255,504, with taxes reassessed at the recommended price and management at 4%, it is a 6.24% capitalization rate; on pro forma rents it is 7.01%.

Three closed Glendale buildings set the number. 333 N Jackson Street, twenty units averaging 677 square feet with one-bedrooms at $1,623, sold for $4,806,000 in April 2026, $240,300 per unit and $355 per square foot on an 11.70 gross rent multiplier. 453 Ivy Street, seventeen 1984 two-bedroom units of 1,148 square feet with an elevator, sold for $7,250,000 in March, $426,471 per unit and $350 per square foot on a 14.62 multiplier over its seventeen conforming units. 332 Riverdale Drive, sixteen units at $1,522 average one-bedroom rent, sold for $3,135,000 in June after 214 days, $195,938 per unit and $287 per square foot. The subject's units are the same size as Jackson's and rent 26% higher, it is 22 years newer, and it carries no manager requirement; at $273,000 per unit it sits 14% above Jackson and well below Ivy, which is where the building belongs.

Price per square foot is the one metric where the subject sits above every comparable, at $409 against $355 at Jackson and $350 at Ivy. It is paid for on the income side: the subject collects $36.79 of scheduled rent per square foot against $30.33 at Jackson, 21% more, and the buyer of 413 E Elk at list receives a higher capitalization rate and a lower gross rent multiplier than the buyers of all three comparables did on the same expense basis. On the metrics that price income, the recommendation is inside the market; on the metric that prices square footage, it is above it by less than the rent difference.

One fact can move the list price. The ownership reports Section 8 contract rent increases scheduled to take effect January 1, 2027. Documented at the 8.7% AB 1482 ceiling across the thirteen assisted units, they add about $30,000 of scheduled rent and support a list price of $4,300,000 at 11.7 times rent, level with the Jackson Street multiplier. Undocumented, they stay out of the price.

Recommended List Price
$4,095,000

Supported value range: $4,000,000 to $4,095,000

Disclosures

Operating figures are drawn from the supporting Marcus & Millichap model dated September 14, 2026. Current rents and laundry income are taken from the ownership rent roll dated August 8, 2026; insurance, water and power, gas and trash are the ownership's reported annual figures, and no lease agreements, Housing Assistance Payments contracts or operating statements were provided. Real estate taxes are carried at a reassessed $45,628, being $44,447 of ad valorem at the county rate of 1.0854% for tax rate area 04045 plus $1,181 of direct assessments, which are flat charges that do not move with the sale price. Repairs, contract services, administration and reserves are underwritten estimates; management is 4% of effective gross income. The financing shown is an illustration at 65% of price, 6% interest and a 30-year amortization; a buyer should obtain its own terms.

Comparable sale prices, dates and physical facts are verified against the recorded deed and the Los Angeles County Assessor record for each property; 333 N Jackson Street is carried at its $4,806,000 deed price rather than its $4,500,000 list price. Gross rent multipliers and capitalization rates for the comparables are LAAA calculations rebuilt from each listing's unit table on the same expense basis as the subject, including a resident manager rent credit on each of the three buildings of sixteen or more units; 453 Ivy Street is carried on its seventeen conforming units, with the non-conforming unit's rent excluded. Unit square footage for the subject and the rental comparables is estimated, not measured.